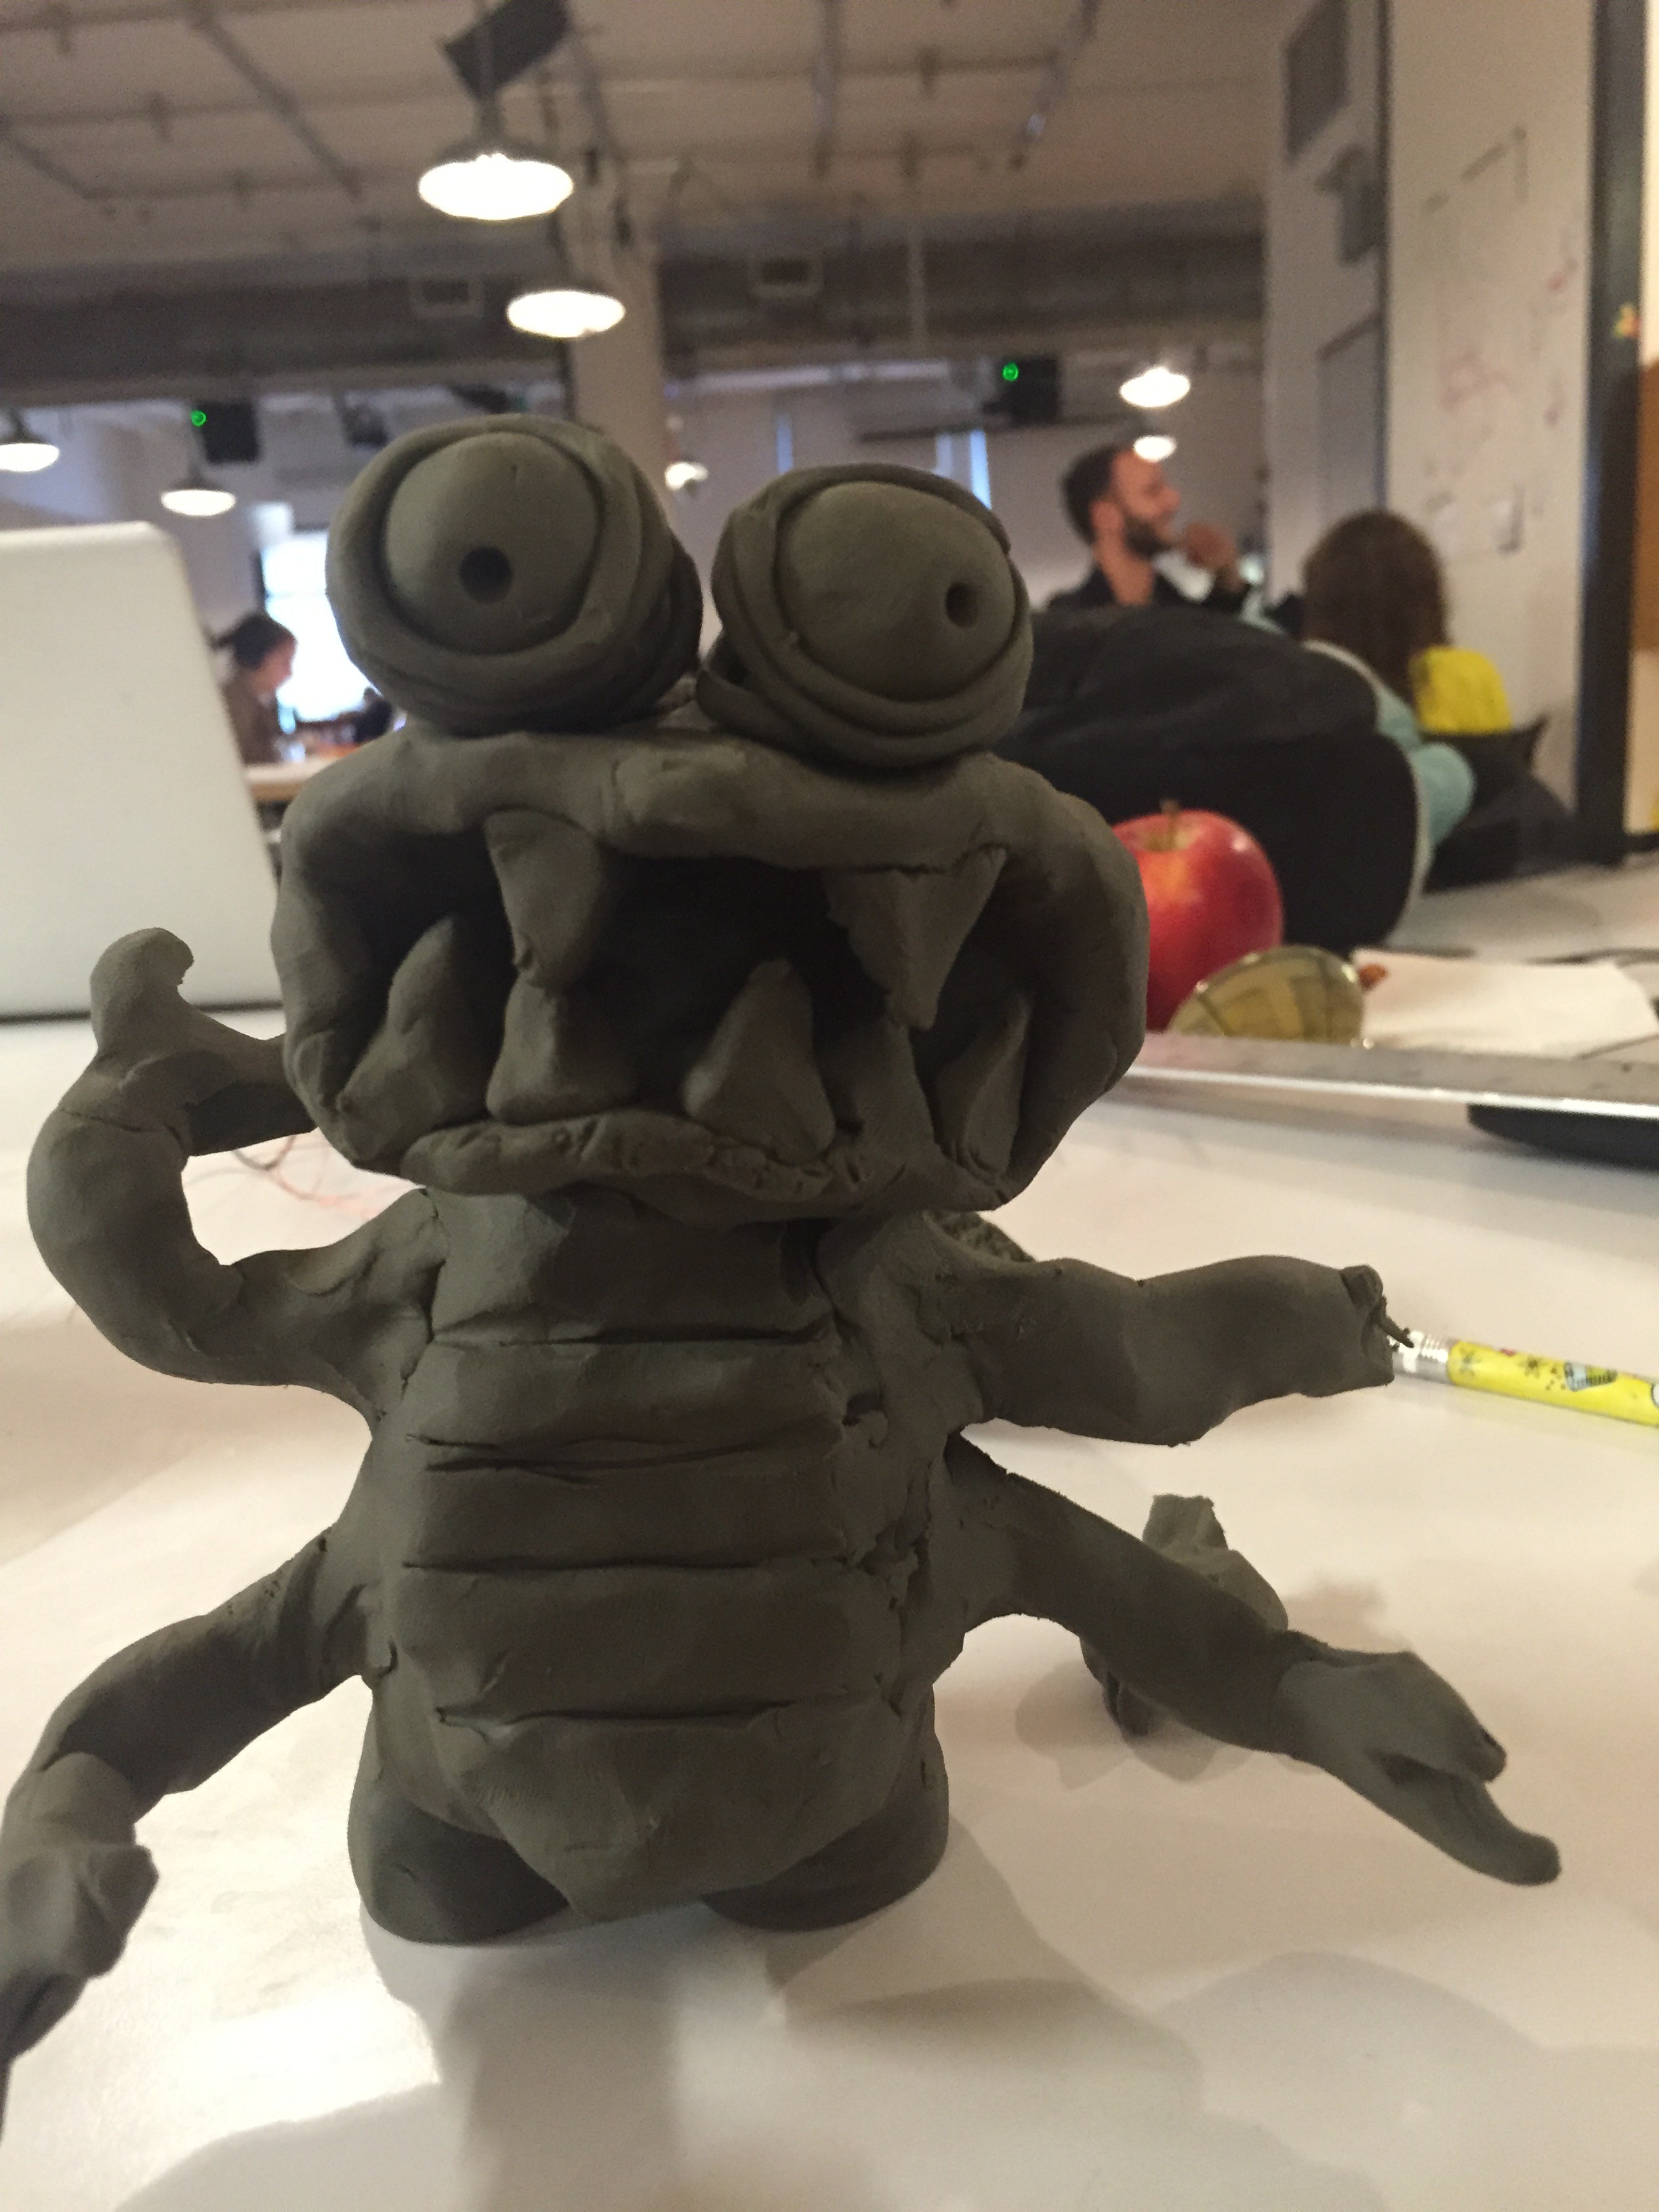
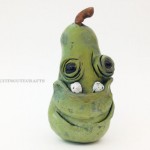
Vinyata and I put together the prototype monster together. We sketched him out in plasticine clay. The idea was to create a monster that was not too cute.
Some of the images we used for inspiration were:
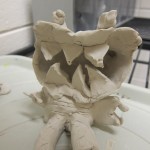
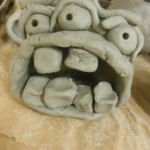
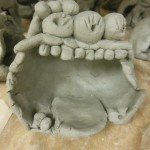
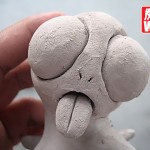


Vinyata and I put together the prototype monster together. We sketched him out in plasticine clay. The idea was to create a monster that was not too cute.
Some of the images we used for inspiration were:

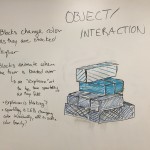
I went into the play testing for this project without doing any substantial planning for the project, or even a clear idea about how to achieve the effects I wanted technically. During the play testing Danny suggested that I could achieve most of what I wanted with an accelerometer, and I think that this is true. The basic interaction for this project is:
The accelerometer knows it is on the floor
1. A person stacks a block on top of another block
The accelerometer senses the change in the X-Axis
The LEDs change color according to the height, creating color gradient
2. A tower is knocked over
The accelerometer senses the change in the X-Axis
The LEDs change color according to the height, creating explosion and sparkle effect
3. The blocks are back on the floor
The accelerometer senses the change in the X-Axis
The LEDs chage color according to the height, resets to the base color
4. Repeat
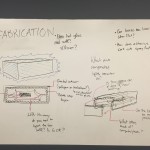
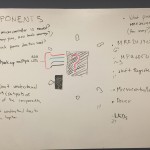
With that in mind the components in each box will be:
The blocks themselves will be made of:
I’m sure that I will end up needing other components and materials as I test and prototype everything, but that list should be what’s at the heart of each box.
Something that won’t make it into this version, as it’s not central to the concept, but that I would love to add to a future version is the MRF24J40MA-I/RM (RF Transceiver Module). It would be a great way to let the boxes communicate with each other and other, as of yet unimagined, components.
My current build plan is:

But that is highly dependent on all the different component orders arriving in a timely manner. I think that one of the main challenges of this project, besides simply getting everything working, will be allowing enough time to make multiple blocks.
My original pitch for the P Comp final was “I want to smash things”. I was fed up with projects that were tied to laptops and other delicate technology or projections that have no corporeal presence. Instead, I wanted to make something that existed as an object on its own that required a fully physicality.
I considered a number of different ideas (including conductive smashables and foam bananas) but eventually settled on light up blocks that can be used to build a tower and then knocked down! I’m hoping to capture the childlike joy of building, then destroying.
For the play test I wanted to see if people would build a tower and then knock it over if I provided the blocks. I also wanted to use the opportunity as a quick materials test for the plastic boxes I’d sourced.
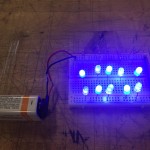
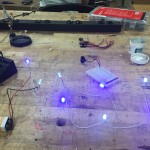
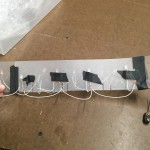
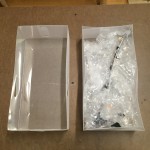
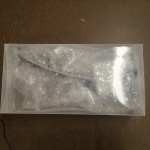
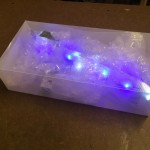
I wired up some LEDs to see how they would look inside the plastic boxes and to see how they would hold up to being thrown around.
My take-aways from the play testing were:
My main challenge with this project has been that I knew that I wanted to make some kind of data visualization, but I did not have a strong idea of the data I wanted to visualize. Dano suggested in class that the main challenge for data-viz is often finding the question that you want to answer. I gave some thought to questions that interested me, what kind of visualizations I enjoy, and came up with a question I would like answered:
Is there an article imbalance on Wikipedia?
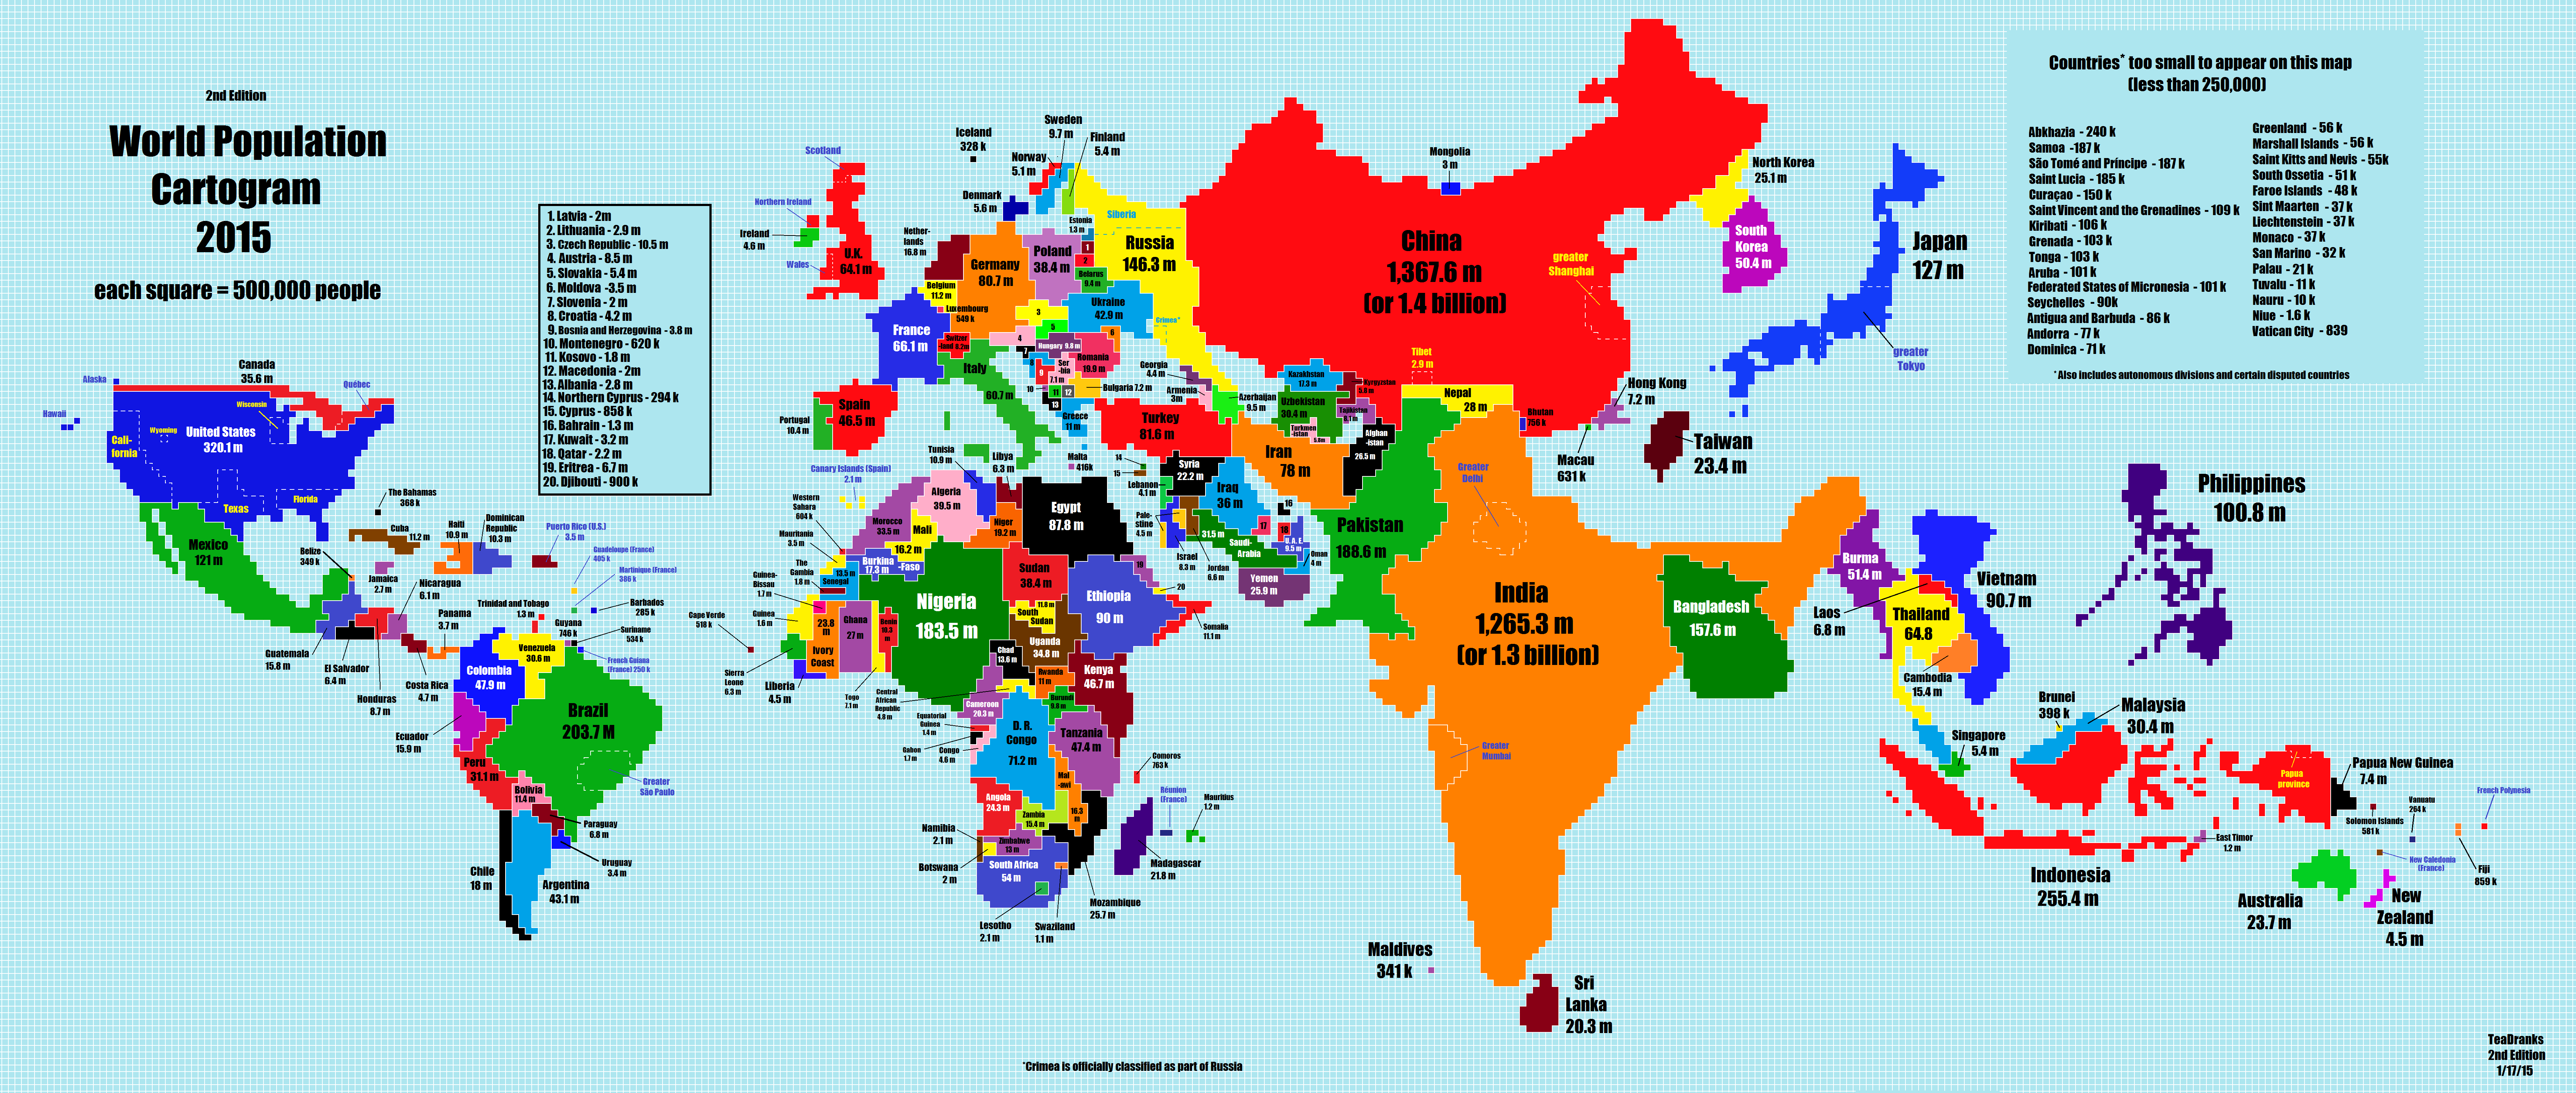
At the moment Wikipedia is the working authority on basically everything. But like any other source of information it has its biases and limits. I’d like to explore what those limits might be. To that end, I would like to make a cartogram showing the size of a country relative to how many english language history articles it has on Wikipedia. There would be a timeline slider, so you can see how different historical periods are represented.
I would have to create the dataset either using the Wikipedia API or by downloading the relevant sections as XML.
Inspiration Visualizations:
Interesting interactive cartogram: http://www.carbonmap.org/

Questions:
Thoughts on showing information on a cartogram vs
How important is it to include information from other languages?
Is D3.js the best way to make this visualization? Is there a good intro to D3?