Hacking Political Rhetoric Final

Screen Shot 2016-12-17 at 4.48.57 PM


http://itp.jscottdutcher.com/eye_video2/

Where you look is what you see.

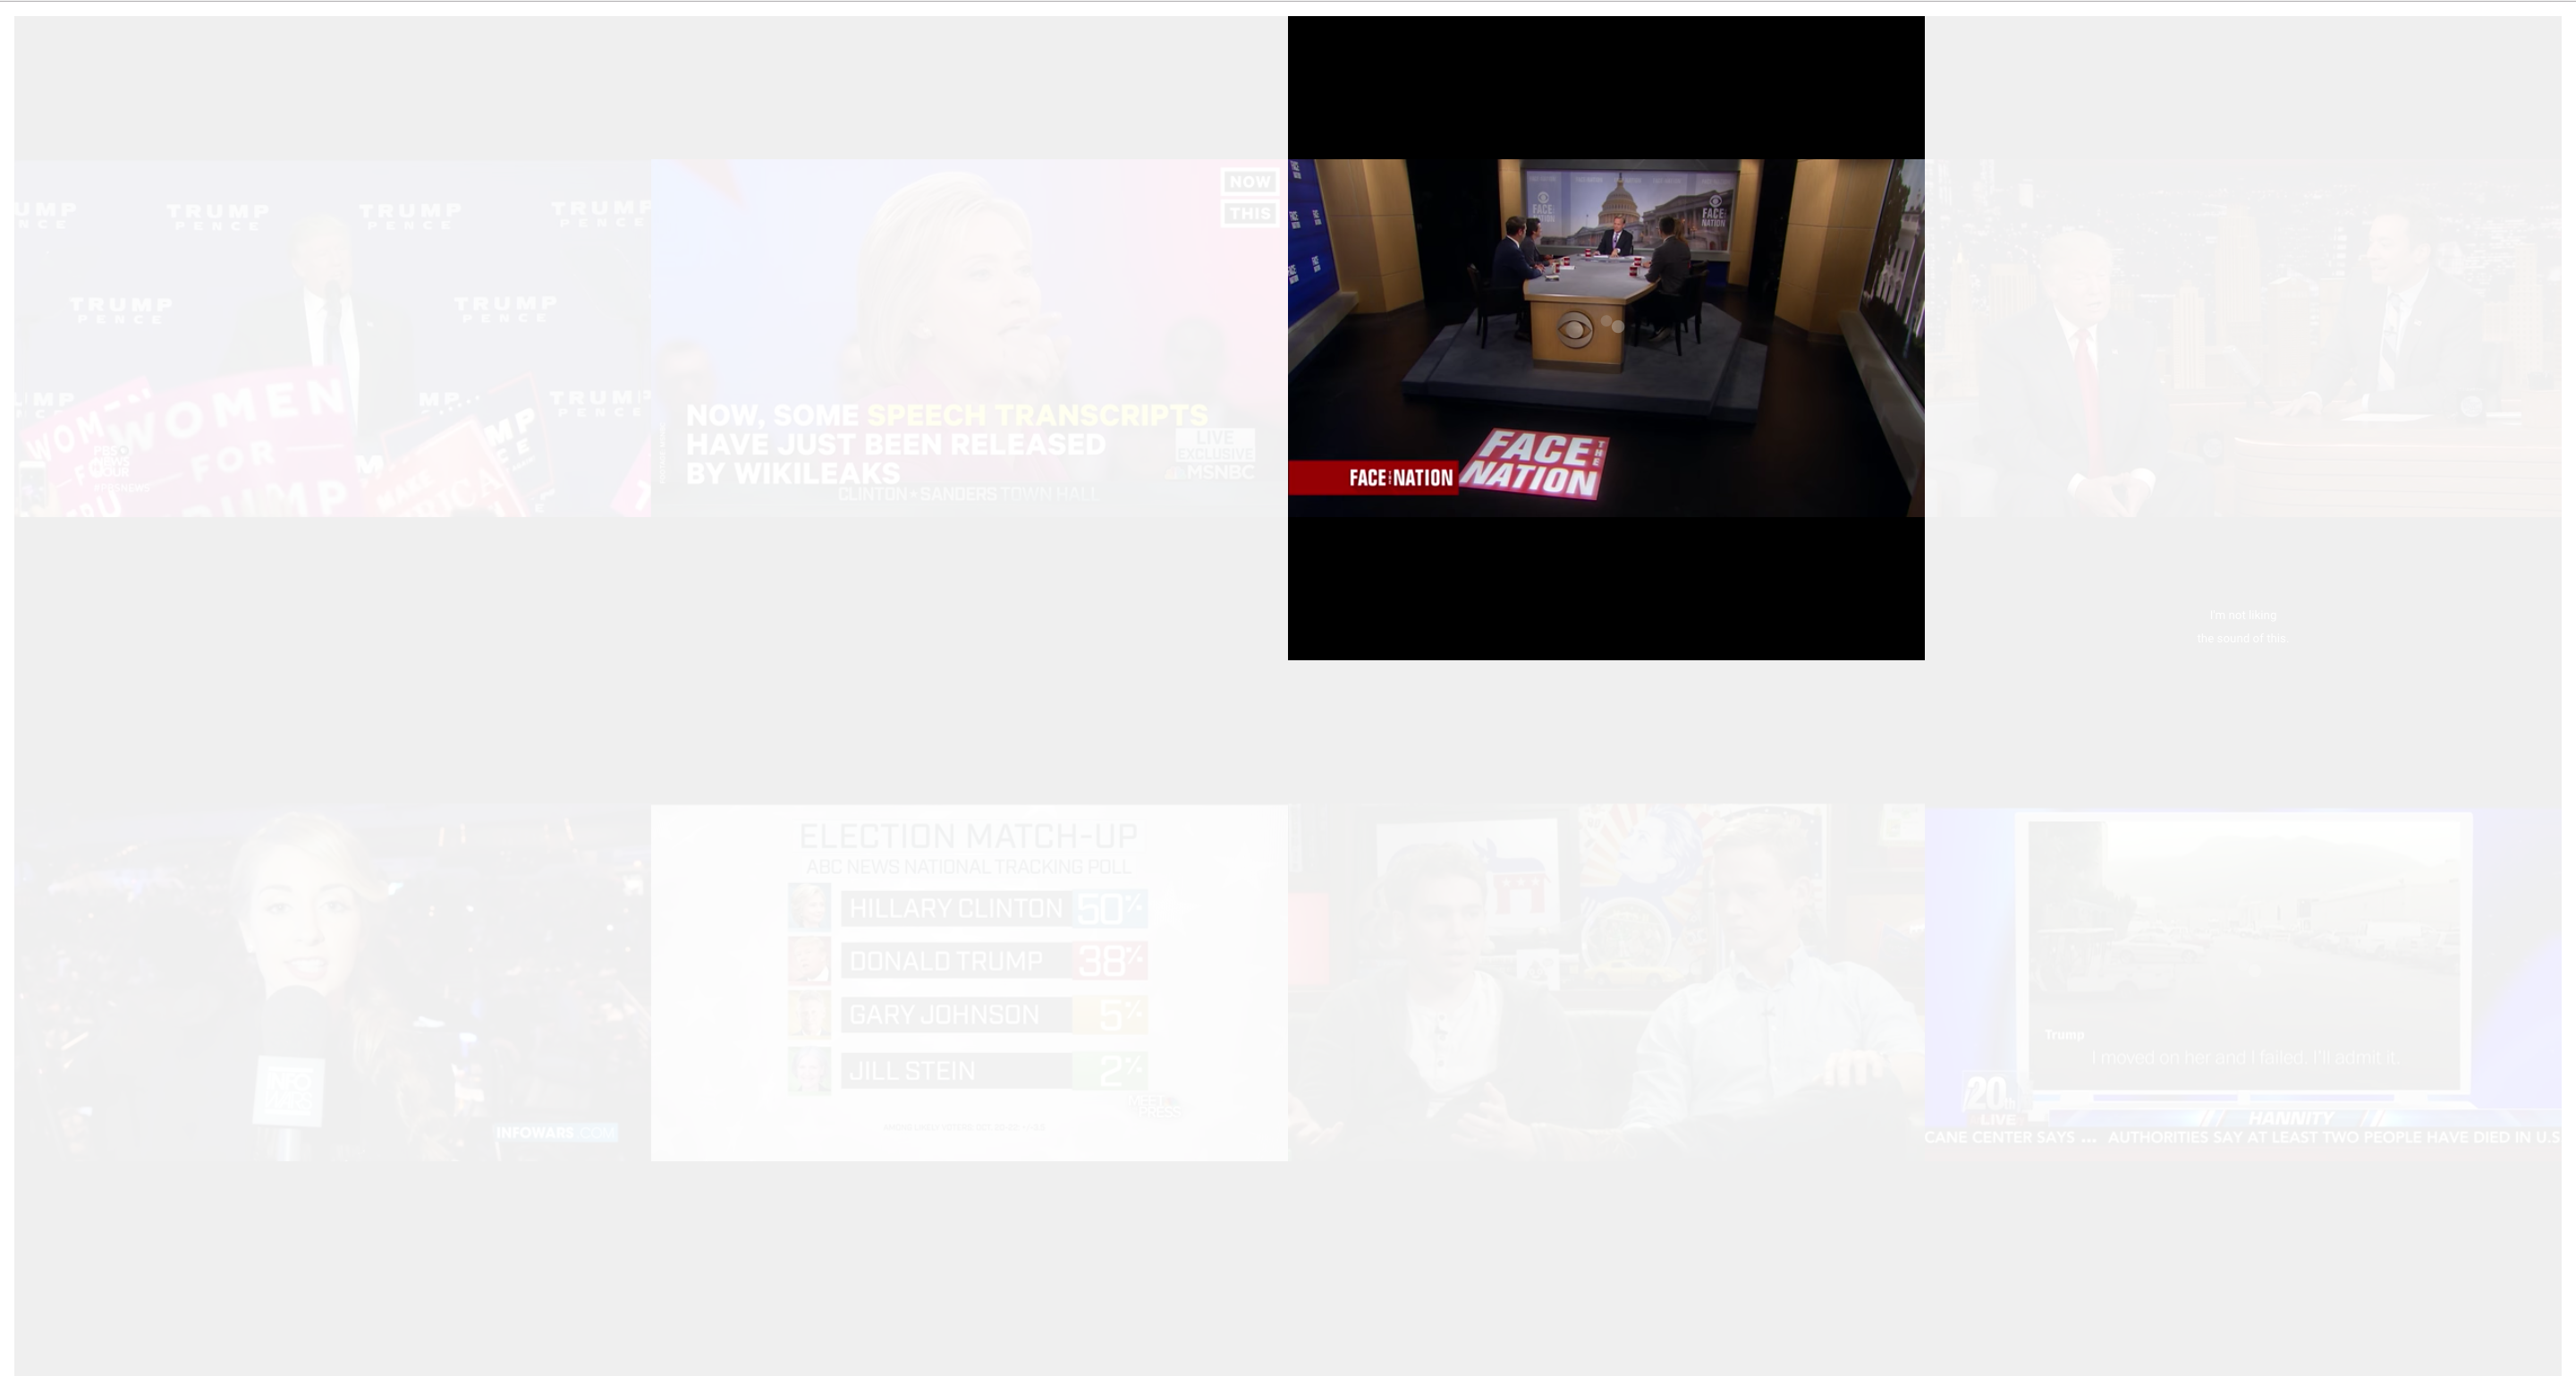
This project is a personal reflection on the 2016 Presidential Election. In the aftermath of the election there has been a great deal of concern about filter bubbles and fake news. It really seems like everyone was looking in a different direction for their news. With this project I am hoping to illustrate the contrast between the narrow slice of the media people consume and the breadth of what is available.

It’s a simple premise, but one that struck a chord with me. I have found myself thinking more and more about the unseen and unknown, and this was another opportunity to explore that concept. What do people not see and why? Does confronting people about the difference between what they see and what is available have any effect? And simply, what things are unseen? I wouldn’t say that I lean on any of these ideas particularly hard in this project, but they are the thoughts that I have been playing around with recently.

I proposed to use eye tracking software to create an experience where only the video someone was looking at was clear, while everything else just faded away. The proof of concept transition that I ended up creating start faded and become clearer when you look at them. This ends up producing an effect of revealing something hidden, like turning over a rock to see what is underneath. I think that it produces the same contrast between the unseen and the seen, but now the viewer may be inclined to see more and discover something unfamiliar.

The main challenge for this project was simply getting all the code to work. I picked webgazer.js for my eye tracking software, largely because it appeared to be the most up to date and well maintained option available. This meant that my project had to live in the browser, which in turn meant that I had to figure out how to deal with all the videos I wanted to use without the whole thing grinding to a halt. Simply embedding youtube videos ended up being the best solution.
A remaining challenge is integrating webgazer.js into the project. I need to setup a site with an SSL certificate in order to use a computer’s webcam. Also, I need to figure out how to get the tracking data out of the canvas and use it for triggering the transition. However, based on my tests it does look like webgazer will run with all of the embedded videos. That’s a huge improvement over previous versions!

Eye Tracking Test from coldsoup753 on Vimeo.

UnseenPlacesUSA Documentation

  https://twitter.com/UnseenPlacesUSA

[Github Link coming soon]

Concept

UnseenPlacesUSA is a Twitter bot and dataset containing the name, description, and the geographic coordinate of ‘unseen places’ in the United States. These places are locations that are unnoticed due to their remote location, or because we choose to put them out of mind. The bot Tweets these places with a sentence describing the location, a Google Maps link, and a satellite photo. The ‘unseen-ness’ of these locations is subjective. A prison is only unseen if you do not know anyone in the prison system. A power plant is only unnoticed if it is not in your neighborhood. Even so, I believe that most of these places are unfamiliar to many people. I hope that by recording the locations and making them more public, people can discover locations they have never heard of, but more importantly that neglected places will be re-considered. Finding an unseen place is an opportunity to consider why that place might be unseen, if its  neglect is appropriate, and what that might say about us. A Twitter bot is an excellent way to perform this data. It allows the places to be considered individually, with a degree of measure. The bot also feels like it is sharing a secret, which is exciting. Pushing the places into a conversational sphere invites discussion and bringing these often remote locations into an intimate space, the tweet will be seen on someone’s phone or computer, contrasts both the size of the physical location and the scope of the systems that the locations represent.

Implementation

The UnseenPlacesUSA Twitter bot is built on Node.js using Twit and the places data is stored in MongoDB. The main challenge of this project was collecting the data itself. I started the dataset with a list of unseen places that I thought would be interesting and then tried to find location data for those places. Most of the data comes from Wikipedia. Wikipedia contains many lists of locations, such as federal prisons, wind farms, and national monuments. I wrote a web scraper that uses node-scrapy. The scraper will run through a list of location names, search for the Wikipedia page, and then scrape the location data from that page. If there is no page or location data, the scraper will write the place name into a file, so I can look up the information manually later.

Other data comes from hobbyist sites, the missile silo data especially, and had to be converted from sexagesimal notation to decimal notation. That was done using formulas I found here. I also wrote a script that takes a street address and converts it into decimal coordinate notation, using the Google Maps API. This was particularly useful for datasets that only contain street addresses, such as the list of cattle feedlots I copied from the American Angus Association.

All of these scripts convert name, location, and description data into a document in my database. I chose to use a database instead of a json document to give this project room to grow in the future. I was also happy to have the chance to learn about using databases.

I had originally planned on setting up some kind of web interface for adding locations to the database, but after processing all the data I have collected so far it has become clear to me that most datasets re individual enough that it would be more work to write the code for a site that can handle them than to simply tweak the templates that I have already created.

Next Steps

In the short term, I would like to build a small dashboard for the dataset. I would like to be able to see what kind of places and how many are present in the dataset at a glance. I also think that it might be worth doing more research into the data I already have. For example, I am interested in differentiating between publically run state prisons and privately run state prisons.

Something else worth considering is how important completeness is for this project. It is not important to have an exact and complete list of all the landfills in New York State, for example, when the information is being tweeted. Each tweet is individual and is not considered as part of a whole. However, when the same information is shown on a map, missing information might become more visible and important. Data omissions also have meaning.

There are also potential new features for the bot. It would be interesting for the bot to be able to tell someone an unseen place, if they tweet a location at the bot. The bot could also be a good way for people to suggest locations they would like to add. Sharing on Twitter is a great way for the project to gain visibility.

I am also excited to explore what kind of future projects this data might lend itself to. I am personally interested to see what it looks like when I bring up all of the satellite images for a state. Will there be commonalities I had never noticed before?
And of course, there is always the ongoing work of finding more unseen places to add.