My main challenge with this project has been that I knew that I wanted to make some kind of data visualization, but I did not have a strong idea of the data I wanted to visualize. Dano suggested in class that the main challenge for data-viz is often finding the question that you want to answer. I gave some thought to questions that interested me, what kind of visualizations I enjoy, and came up with a question I would like answered:
Is there an article imbalance on Wikipedia?
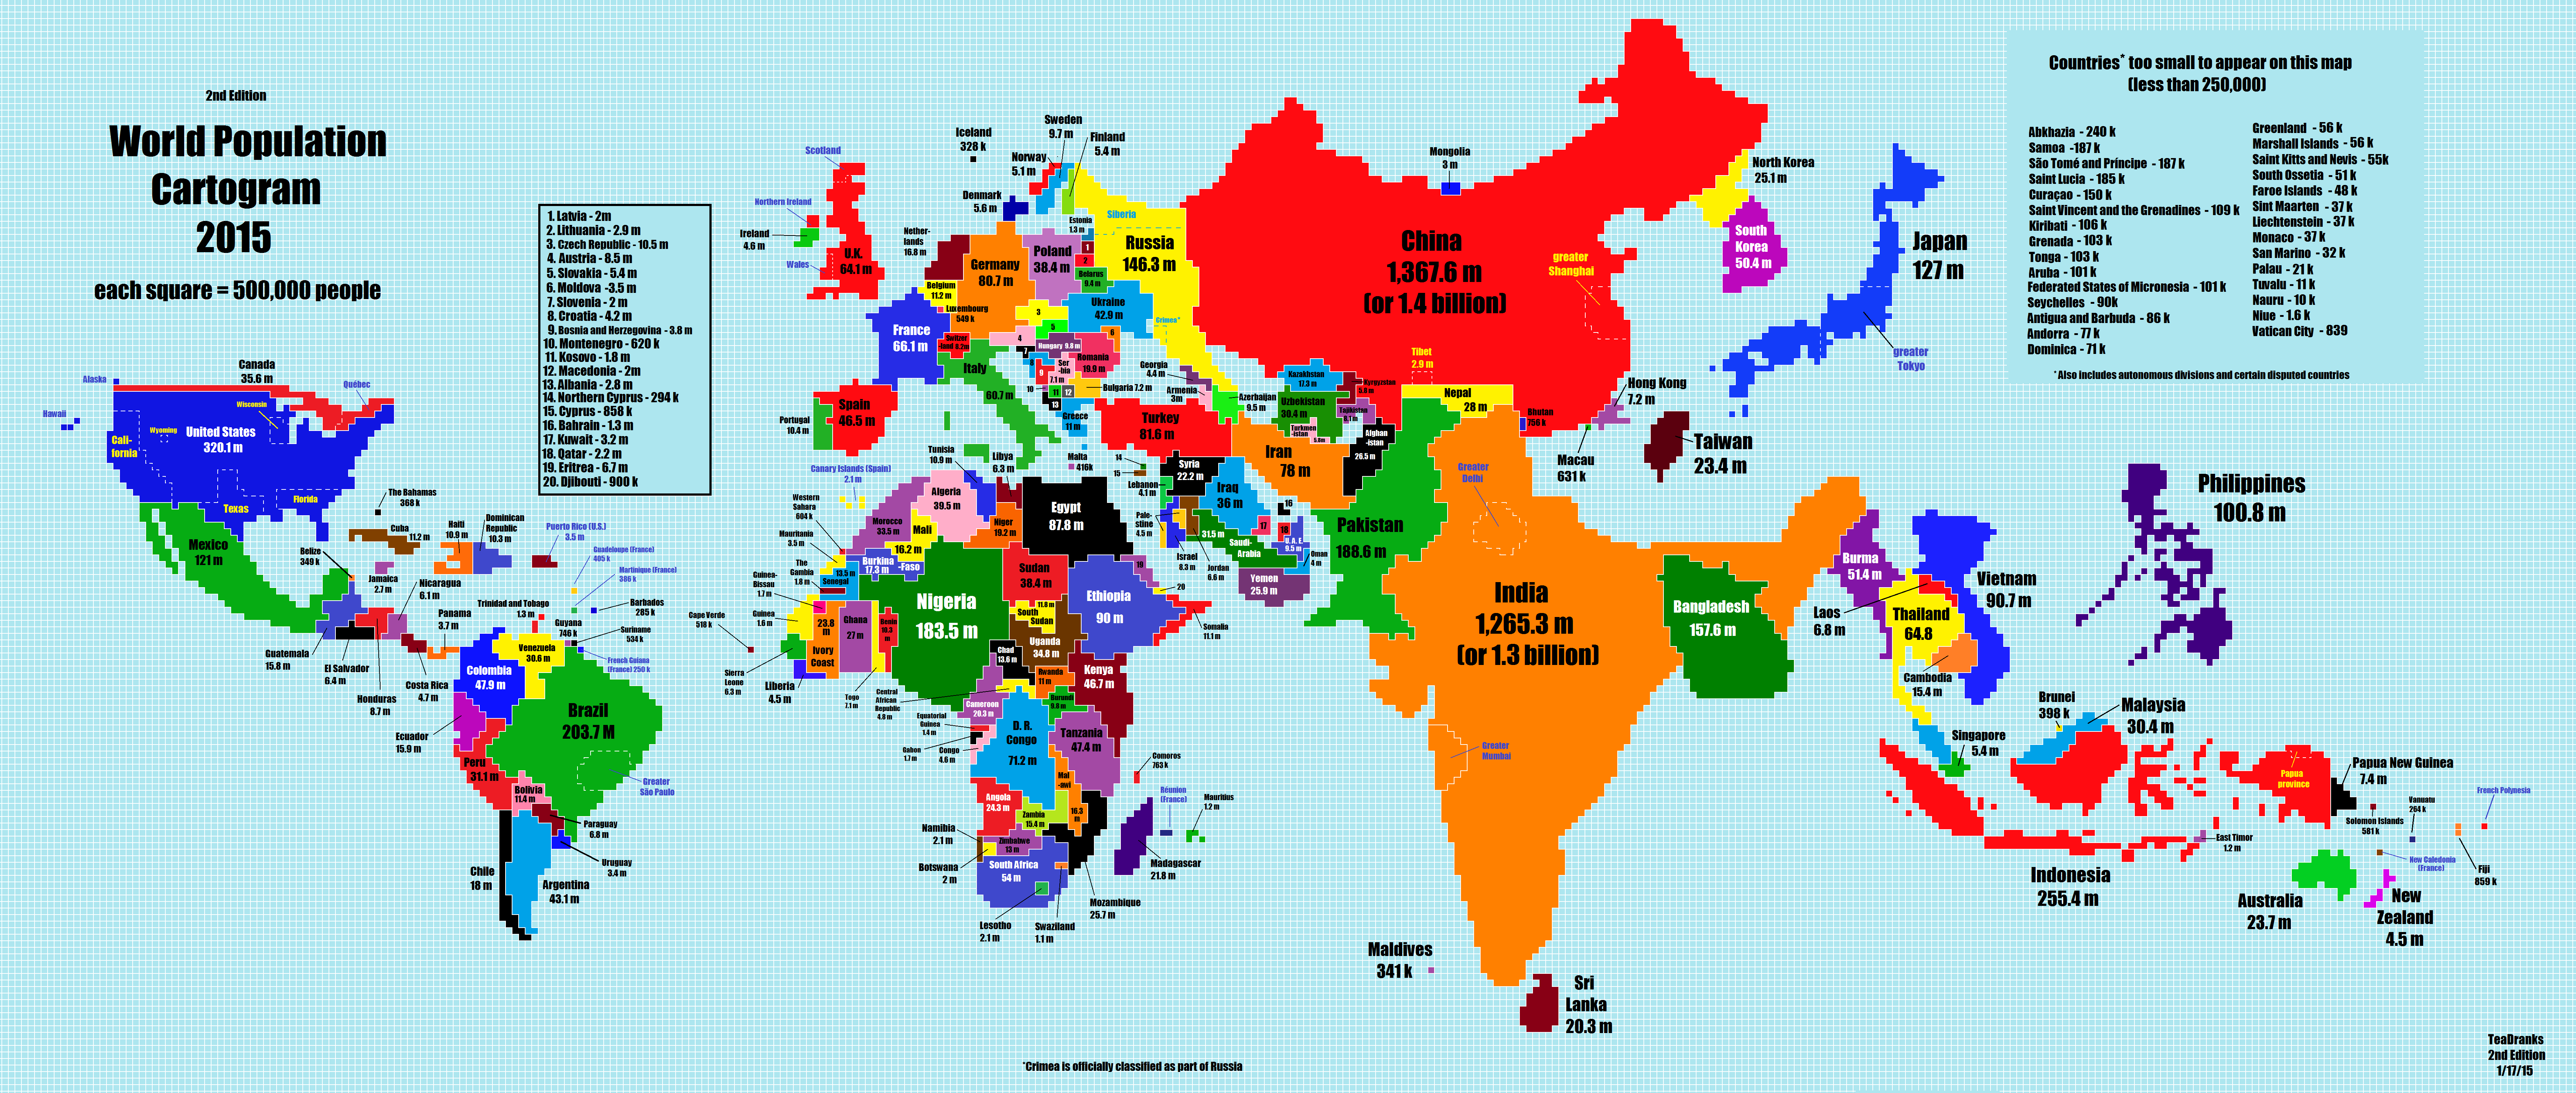
At the moment Wikipedia is the working authority on basically everything. But like any other source of information it has its biases and limits. I’d like to explore what those limits might be. To that end, I would like to make a cartogram showing the size of a country relative to how many english language history articles it has on Wikipedia. There would be a timeline slider, so you can see how different historical periods are represented.
I would have to create the dataset either using the Wikipedia API or by downloading the relevant sections as XML.
Inspiration Visualizations:
Interesting interactive cartogram: http://www.carbonmap.org/

Questions:
Thoughts on showing information on a cartogram vs
How important is it to include information from other languages?
Is D3.js the best way to make this visualization? Is there a good intro to D3?